Execution Panel
See what every step sent and received, follow the timeline, and compare responses in the Lumen Flow Execution Panel.
The Execution Panel shows what actually happened when a Flow ran: steps, duration, validations, request, response, and resolved variables. It opens with execution and follows the selected canvas step.
Close to the Flow when that helps
By default, the Execution Panel is docked to the bottom of the canvas. This keeps the Flow structure and its result visible together, without changing context to inspect a response.
When you need more room, you can undock it into its own window and dock it again later. The selection and displayed execution remain synchronized across both presentations.
Compare one step with another
Yes, this interaction is worth showing: drag a step to the Execution Panel — docked or undocked — to set it as the baseline. The current step is compared with the baseline’s latest execution that has a response body, and the result is shown as a unified, line-by-line diff.
This is useful for investigating changes between endpoints, Flow branches, or executions without losing the response you are inspecting.
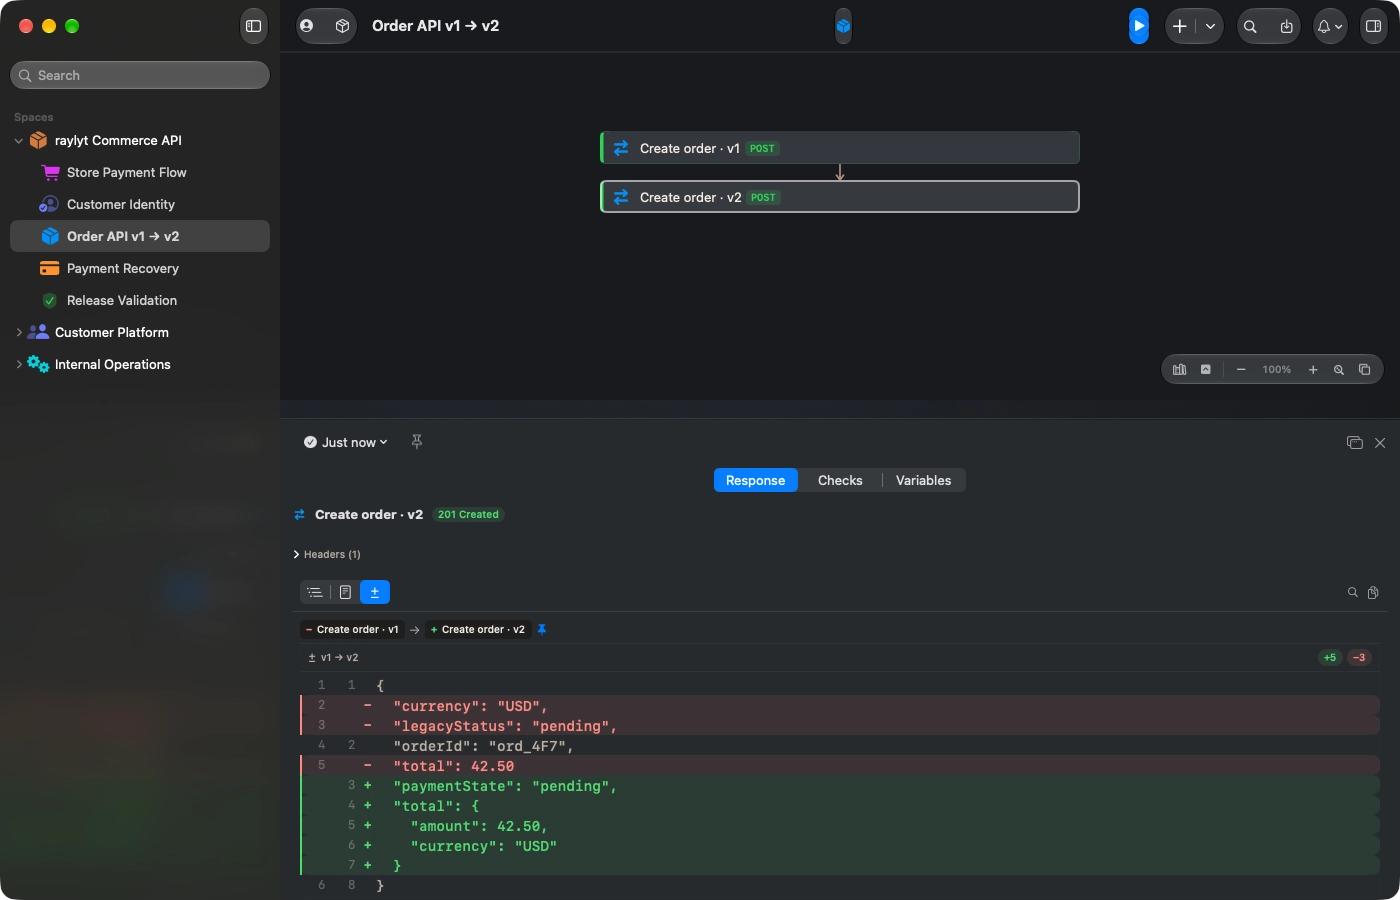
Execution Panel docked to the canvas · The canvas above a docked response panel comparing two completed calls.

Ready to elevate your API workflow?
Sign up for early access and get notified as soon as it's available for macOS.
Join the waitlistmacOS 26 or higher · Native Apple Silicon